看啥推荐读物

专栏名称: Alyna_C
今天看啥
微信公众号rss订阅, 微信rss, 稳定的RSS源
目录
相关文章推荐

|
大数据文摘 · 在 ICLR 2024,看见中国大模型的力量· 昨天 |

|
CDA数据分析师 · 【数据干货】财富密码揭秘:金融行业全量数据透视· 3 天前 |

|
InfoTech · 3小时内用ChatGPT写完一篇论文的终极指南· 5 天前 |

|
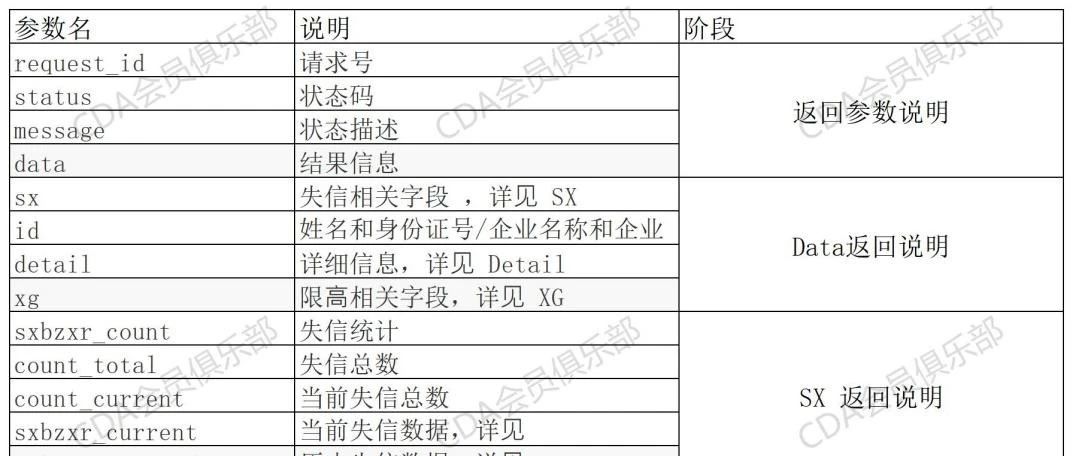
CDA数据分析师 · 【数据干货】你了解个人的信用状况吗?揭秘司法 ...· 1 周前 |


推荐文章
|
|
CDA数据分析师 · 【数据干货】财富密码揭秘:金融行业全量数据透视 3 天前 |
|
|
InfoTech · 3小时内用ChatGPT写完一篇论文的终极指南 5 天前 |

|
新北方 · 大连将新增这些停车场、充电桩、车位! 1 年前 |
|
|
温sir讲地缘 · 先秦篇24-存邢救卫 2 年前 |

|
养身厨房 · 早餐吃两块它,祛湿健脾!排出湿毒,便秘没了,肚子也小了~ 4 年前 |